The Storm Report

  • Home
  • Radio Weather
  • Staff
  • Interactive Radar
  • Contact Us

January 3, 2021 By Jennifer Narramore

Biggest Events of 2020: Record-Breaking Hurricane Season

https://youtu.be/xrfEUunpS38

This satellite animation is from NOAA’s GOES-16 (GOES East) satellite and runs from May 13 through November 18, 2020. Video via NOAA.

It was the tropical season that seemed to never end!  The 2020 Atlantic hurricane season was extremely active and several records were set.  Here are just a few:

  • There were 30 named storms, from Arthur to Iota. This is the most storms on record. Previously, the record was 28 set in 2005.  
  • Thirteen hurricanes formed and six were major hurricanes. This is the second-highest number of hurricanes on record.
  • For the sixth year in a row, a named system formed BEFORE the official start of hurricane season (June 1).  This was Arthur on May 16. 
  • Twelve storms made landfall in the continental US, five of which came in across parts of Louisiana.  Previous record was nine set in 1916.
  • Only the second time in history that the Greek alphabet was used.
  • A record nine named storms formed from May through July.

This infographic from NOAA National Weather Service highlights key facts and statistics from the 2020 Atlantic Hurricane Season (at the time of publishing on November 24).

Overview of the 12 Landfalling Storms in the Continental U.S.

Tropical Storm Bertha


Image via The National Hurricane Center summary of this storm.

Bertha was a pre-season tropical system.  It formed off the coast of the Southeastern US on May 27, eight days after Tropical Storm Arthur dissipated near Bermuda.  It should be noted that Arthur did bring some tropical storm force winds to the Outer Banks of North Carolina but did not officially make landfall. 

Peak intensity of Bertha was at 50 mph when it was centered 30 miles ESE of Charleston, SC.  Landfall occurred on May 27 near the Isle of Palms, SC.  The storm weakened quickly and dissipated over the Ohio Valley on May 28. Main impact from Bertha was heavy rain across the eastern portions of South Carolina. A general 2-4 inches was reported with locally higher amounts.  Per the National Hurricane Center, “Much higher rainfall amounts of up to 15 inches occurred across portions of southeastern Florida in association with the precursor disturbance of Bertha.”

Tropical Storm Cristobal

On June 1, a tropical depression formed in the Bay of Campeche.  The depression formed from the remnants of a Pacific storm, Tropical Storm Amanda.  On June 2, the system had strengthened and Tropical Storm Cristobal was born.  The first landfall of Cristobal occurred on June 3 in the state of Campeche, Mexico.  Maximum winds were estimated at 60 mph. The storm weakened over this area and then strengthened again as it lifted back into the Gulf of Mexico.  A second landfall occurred on June 7 along the coast of southeast Louisiana between the mouth of the Mississippi River and Grand Isle with winds near the center at 50 mph. The storm weakened and moved north through the Mississippi Valley Region and dissipated on June 13. 

Cristobal is the earliest third named storm on record in the Atlantic Basin. Per the National Weather Service (NWS), on June 9, Cristobal (which had weakened to a tropical depression) moved through parts of Wisconsin.  This was the first time a tropical depression had ever crossed into the state.  Per NWS Milwaukee, “Not only was Cristobal Wisconsin’s first tropical depression, but its path was the furthest northwest ever taken by a tropical system since the beginning of records.”


Radar showing Cristobal’s rain pushing through Wisconsin via NWS Milwaukee.
  • Significant flooding occurred across the Yucatan Peninsula. 
  • In Canada, nearly 300,000 people were without power due to the high winds. And several tornadoes were confirmed including an EF-2, near Mary Lake. 
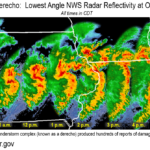
  • The remnants of Cristobal produced a derecho across IN, MI, OH, PA and NY. There was widespread wind damage from the tropical cyclone-induced derecho, and even an EF-2 tornado in Beaver County, PA. 
  • Green Bay, WI experienced the lowest pressure on record at 986 MB.

Tropical Storm Fay

During the early parts of July, an area of low pressure developed over the Northern Gulf of Mexico.  It moved across the Florida Panhandle and through the Southeastern U.S. and pressed off the coast of North Carolina.  On July 9, reconnaissance aircraft determined that Tropical Storm Fay had formed with maximum sustained winds of 45 mph.  The storm moved north and made a landfall on July 10 NNE of Atlantic City, NJ.  It quickly weakened into a post-tropical low and the last advisory from the NHC was at 5am EDT on July 11. This was the first tropical storm to make landfall in New Jersey since Irene in 2011. Fay was the earliest 6th named storm on record. 

  • Coastal flooding and minor storm surge battered the Delmarva Peninsula and NJ
  • Flash flooding was reported across portions of eastern Pennsylvania. 
  • New York City subway stations were flooded. 
  • Six fatalities were caused due to rip currents in NJ, NY, and RI.

https://youtu.be/C61tt2F2aJ4

Hurricane Hanna

Hanna was the first land-falling hurricane of the historic 2020 season.  It began as a tropical depression on July 24 with the center 385 miles ESE of Corpus Christi, TX.  The depression strengthened to a tropical storm on July 24 and then intensified further and became a hurricane on July 25. The maximum winds with Hanna reached 90 mph just before making landfall at Padre Island, TX. A second landfall occurred in Kenedy County about 15 miles NNW of Port Mansfield.

  • Widespread flash flooding occurred across southern TX. 
  • The Bob Hall Pier in Corpus Christi collapsed due to a combination of storm surge and high winds. 
  • The Texas State Aquarium was flooded due to storm surge. 
  • An EF-0 tornado damaged a hangar at the Brownsville/South Padre International Airport. 
  • Several streets flooded in Monterrey Mexico.

Our Warning Coordination Meteorologist took a trip with the Coast Guard to survey the damage along the Middle Texas coast. The powerful storm surge resulted in drastic beach erosion as well as severe damage to Bob Hall Pier. #Hanna #txwx pic.twitter.com/kdCJfxlAOM

— NWS Corpus Christi (@NWSCorpus) August 2, 2020

Hurricane Isaias

Isaias began as a tropical wave off the coast of Africa on July 23.  It strengthened to a tropical storm seven days later and passed south of Puerto Rico and into the Dominican Republic.  Isaias became a hurricane and made landfall on North Andros in the Bahamas with max winds of 80 mph. It weakened slightly and ran parallel along the Florida and Georgia Coasts as a tropical storm.  It did strengthen back to hurricane status before making a landfall on Ocean Isle Beach, NC.  Max winds were at 85 mph.  The system raced up the east coast and dissipated on August 6.

Isaias spawned a rather large tornado outbreak. Over three dozen twisters were confirmed. 


Map of confirmed tornadoes and tornado warnings issued by the National Weather Service from August 3 through August 5, 2020, in connection with Hurricane Isaias. Map produced in QGIS with border outlines from the United States Census Bureau. National Weather Service warning outlines available from the Iowa Environmental Mesonet and tornado data available from the National Weather Service. Isaias tracking data from the National Hurricane Center. Via The Austin Man on Wikipedia.

The strongest tornado of the outbreak occurred on August 4. It traveled 10 miles through parts of Bertie County, NC.  The greatest intensity occurred south of Woodard.  Peaks winds were estimated by the NWS to be 140-145 mph (EF-3). Several mobile homes and stick built houses were destroyed.  Per the NWS,  “It flattened seven single-wide and double-wide mobile homes, leaving unrecognizable bits of debris.” There were two fatalities and 14 injuries due to this tornado. This was the strongest tornado spawned by a tropical system since 2005.

https://www.youtube.com/watch?v=55PZFJPqYZc

A long-track tornado spawned by Isaias occurred in Delaware. It moved for 35.5 miles from near Rising Sun, through Dover, Smyrna, and Middletown, dissipating south of Glasgow. It was rated EF-2 with peak winds of 115 mph. This is the longest tornado path documented in Delaware since 1950. A 96 mph wind gust was measured by a DelDOT weather station north of Smyrna. EF-2 damage occurred near Middletown, several homes had roofs and partial wall loss. At least 12 homes were declared uninhabitable. The tornado also produced severe damage to trees and corn fields. 


Image via NWS Mount Holly.

The strong winds from Isaias battered the Carolinas to New England causing widespread power outages.  Per Con Edison, it was the second largest outage in its history.

#StormIsaias’s outage is the second largest in our long history. With 257,000 customers out surpassing Hurricane Irene; we are focused on safe restoration. Click the link for all the details: https://t.co/RCgS8w99Fu #poweringthrutogether pic.twitter.com/cJzUJP2H33

— Con Edison (@ConEdison) August 5, 2020

  • $4.8 billion in damage.
  • 3100 trees were knocked in Queens, NY.
  • 148 mph wind gust was recorded on Mount Washington, the strongest gust ever recorded there in August.
  • Widespread flooding in the Philadelphia area resulted in numerous water rescues.

Hurricane Laura


NOAA Satellite Image of Hurricane Laura on August 26, 2020.

Hurricane Laura at Cameron, LA Landfall. Left: 2km Infrared satellite image at 0556 UTC (12:56 AM CDT). Right: Lake Charles, LA WSR-88D radar image at 0553 UTC (12:53 AM CDT) on August 27, 2020. Via NWS Lake Charles.

Laura was the first major hurricane of the 2020 season.  It began as a tropical wave off the coast of Africa on August 16.  It continued its trek east eventually becoming a tropical storm on August 21.  It was the earliest twelfth named Atlantic storm on record.  The center moved across the northern Lesser Antilles and south of Puerto Rico. A landfall occurred over Hispaniola and then Eastern Cuba on August 23-24. As Laura moved through the Gulf of Mexico, it began to strengthen and reached peak intensity of 150 mph on August 26 just south of the coastal areas of Southwest Louisiana.  Major hurricane Laura made landfall at Cameron, LA around 1am CDT on August 27.  It was the strongest hurricane to strike this area since records began in 1851. 

  • $19 Billion in damage
  • First major hurricane to strike the US Mainland since Michael in October 2018. 
  • Major storm surge damage occurred along the Louisiana Coastline. 
  • 17 foot storm surge confirmed in Rutherford Beach, and Creole, LA. 
  • Extensive wind damage occurred to Lake Charles, LA with hundreds of buildings being heavily damaged or destroyed. 
  • Several tornadoes were confirmed across parts of AL, AR, MS and TN, including an EF-2 tornado that hit near Maynard, AR. 
  • The WSR-88 at  NWS Lake Charles was destroyed. 

NWS Lake Charles Radar after Laura via their summary page.

Soldiers from the Louisiana National Guard respond immediately after Hurricane Laura destroyed much of Lake Charles. They performed route clearance, and search and rescue missions. Via Josiah Pugh on Wikipedia.

Hurricane Marco

Marco was spawned from a tropical wave that made a trek through the Central Atlantic. It became a tropical depression on August 20 about 235 miles east of the Nicaragua-Honduras border.  The system moved into the Northwest Caribbean, strengthened to a tropical storm and then quickly to a hurricane on August 22. It weakened in the Yucatan Channel then strengthened again to a Category 1 hurricane in the warm waters of the Gulf of Mexico on August 23. This occurred at the same time Laura was hitting Hispaniola and Cuba.  

As Marco moved north toward the U.S. Coast, it encountered tremendous wind shear and was torn apart.  A much weaker tropical storm Marco made landfall near the mouth of the Mississippi River on August 24. 

  • 11.81” of rain fell near Panama City FL
  • Highest Observed wind gust occurred at Petit Bois Island, MS at 38 mph

Talking about a close call! Lightning struck uncomfortably close to lifeguards in Panama City Beach, FL. They were clearing the beach as Tropical Storm #Marco moved through. pic.twitter.com/a55qCtcyXV

— Pattrn (@pattrn) August 25, 2020

Yesterday in Panama City Beach, Florida! – Remnants of Hurricane Marco!

Permission: Shannon Meadows | 08-24-2020@WeatherBug pic.twitter.com/QQWUTH3vJm

— Live Storm Chasers (@Livestormchaser) August 25, 2020

Hurricane Sally


Via NWS Mobile.

Sally was a September storm that had a big impact on the Gulf Coast region. It became a tropical depression on September 11.  The depression made landfall at Key Biscayne, FL and then moved into the Gulf of Mexico and strengthened.  Sally fluctuated in its intensity eventually peaking as a Category 2 storm with maximum winds of 105 mph as it made landfall near Gulf Shores, AL. 

  • $7.3 billion in damage.
  • 36” of rain in Tiger Point FL.
  • 121 mph wind gust recorded at Fort Morgan, AL. 
  • Heavy storm surge damage recorded along the Alabama Coastline. 
  • A crane fell onto the Pensacola Bay Bridge, destroying a portion of it. 
  • 22 barges in Pensacola Bay and two riverboat casinos in Mobile Bay broke loose from their moorings.
  • Wind damage and flooding continued across Georgia and into the Carolinas. 

NEW video from Navarre Park in Navarre, Florida as a result of Hurricane Sally!

Permission: LittlesLife&Laughter | ropp_christina – 09-16-2020@Weatherbug – Download the app today!#HurricaneSally2020 #Saly #HurricaneSally pic.twitter.com/qtFqxlDX7M

— Live Storm Chasers (@Livestormchaser) September 17, 2020

Watch: Drone footage shows damage to Three Mile Bridge in Pensacola after Hurricane Sally https://t.co/vwjHb17QTH pic.twitter.com/zzVd8vhj2q

— PNJ (@pnj) September 18, 2020

A pier in Orange Beach, Alabama is washed away as Hurricane Sally slams the Gulf Coast, with some areas already receiving up to 25 inches of rain. https://t.co/0XnlhdJpAB pic.twitter.com/OVDtamSnPl

— ABC News (@ABC) September 16, 2020

Uh, that’s a no from me 😳🐊 — HUGE alligator in Gulf Shores, Alabama displaced in a neighborhood from Hurricane Sally’s surge. 📸Tina Bennett @WGNOtv @HankAllenWX @BrookeLaizer_Wx #HurricaneSally pic.twitter.com/zXgcALvTHa

— Scot Pilié (@ScotPilie_Wx) September 16, 2020

Tropical Storm Beta

Tropical Storm Beta began as a disturbance in the Northeast Gulf of Mexico on September 10.  It had a hard time getting its act together until Hurricane Sally moved into the Southeastern U.S.  Once that happened, the wave became a depression on September 16 and then a minimal tropical storm on September 17.  It meandered a bit then began a westerly movement toward Texas and a landfall occurred on September 21 near Matagorda Peninsula.  

  • Large waves destroyed part of a pier in Galveston, TX. 
  • Storm surge flooding inundated parts of Coastal Texas. 
  • 48 mph wind gust in Port Lavaca, TX. 
  • Flooding was reported across the Houston Metro area, with over 100 high-water rescues taking place in the city. 
  • The remnants procured a small severe weather event across the Carolinas on September 25. Baseball sized hail and damaging winds occurred, and an EF-0 tornado hit Myrtle Beach, SC.

Coastal flooding caused by Beta in Corpus Christi, Texas on September 21, 2020 as viewed from the JFK Causeway. Via Robloxsupersuperhappyface on Wikipedia.

Hurricane Delta

Delta first came on the scene on October 1 as a tropical wave over the Eastern Caribbean.  The National Hurricane Center gave us the heads up that this system had the potential of becoming a cyclone on October 4 and it officially became a tropical storm on the 5th.  Delta intensified quickly and on Oct 6 was already a Category 2 hurricane.  Meteorologist Philip Klotzbach tweeted the following: 

#Delta has intensified by 70 mph (from 40 mph to 110 mph) in its first 24 hours since becoming a named storm. This is the most intensification in a 24 hour period for an October Atlantic named storm since Wilma in 2005. #hurricane pic.twitter.com/Dc5EkZpFSj

— Philip Klotzbach (@philklotzbach) October 6, 2020

Delta continued to increase in intensity.  At 1120am EDT, an update was submitted by the National Hurricane Center stating, “Data from a NOAA Hurricane Hunter aircraft indicate that Delta is continuing to rapidly strengthen.  The maximum winds have increased to near 130 mph with higher gusts.”  Delta was now a Category 4 storm 125 mile SW of Grand Cayman. 

Delta encountered some shear and weakened to a Category 2 system as it made landfall in Mexico. It weakened slightly more over the Yucatan Peninsula and began to restrengthen in the Gulf of Mexico.  It fluctuated in intensity as it moved toward the Gulf Coast and eventually crossed near Creole, LA with max winds of 100 mph. 

  • $2.9 Billion in damage.
  • Made landfall just 12 miles east of where Hurricane Laura made landfall. 
  • 96 mph wind gust recorded at Lake Arthur, LA.
  • Homes that were heavily damaged by Hurricane Laura were damaged again. 
  • Several tornadoes recorded across AL, GA, MS, NC, and SC. 

Fort Polk, LA WSR-88D radar image of Hurricane Delta Landfall at 2259 UTC (5:59 PM CDT) on October 9, 2020 via NWS Lake Charles.

Drone footage of terrible devastation east of Creole, Louisiana the morning after Hurricane #Delta. Much of this total destruction is from Hurricane Laura in August, with the flood waters from Delta surge and rainfall runoff. @RadarOmega_WX pic.twitter.com/hvbDrGjGsq

— Reed Timmer (@ReedTimmerAccu) October 12, 2020

NEW FOOTAGE: Check out some of the surge & wave highlights from Hurricane #Delta as seen from Cypremort Point, Louisiana. Later in the night, waves were over 20+ feet and were taller than the pier roofs before they even crested and slammed onshore! #LAwx pic.twitter.com/NJjdfEFEdT

— Aaron Rigsby (@AaronRigsbyOSC) October 11, 2020

Hurricane Zeta


Hurricane Zeta was pictured from the International Space Station as the category two storm churned in the Gulf of Mexico nearing Louisiana. At lower right, is a portion of one of the Northrop Grumman resupply ship’s cymbal-shaped UltraFlex solar arrays. Via NASA Johnson on Flickr.

Zeta had a similar track as Delta, moving out of the eastern Caribbean, clipping the Yucatan Peninsula and then moving right back into the Gulf of Mexico.  This storm also had the Louisiana Coast in its sight. It made its approach to the coast on October 28 as a Category 2 hurricane. It was at peak intensity with winds of 110 mph when it made landfall in Cocodrie, LA.  The system raced inland through the deep south and into Virginia.  It turned toward New England and brought accumulating snow to the area.

  • $3.5 Billion in damage
  • 112 mph wind gust at Shell Beach, LA.
  • Storm surge flooding affected Coastal Louisiana and Mississippi. 
  • Inland tropical storm warnings stretched across AL, GA, TN, SC NC into VA. Wind gusts as high as 80 mph produced widespread damage across these inland areas. 
  • Produced snow across New England, 6.5” recorded in Grafton, MA. 

In the latest episode of the 2020 Hurricane Season: #Zeta's northern eyewall continues to fire off strong convective bursts over the newly-discovered Gulf of Mississippi.

A significant inland wind event is underway, with Tropical Storm Warnings all the way to southern Virginia. pic.twitter.com/IUAMTmj7nB

— Jake Carstens (@JakeCarstens) October 29, 2020

Photos taken in Chauvin, LA from my latest @DeSmogBlog report on #HurricaneZeta's aftermath: https://t.co/1uCyjGJ3MB. “One thing we’re finding is that tropical storms are much more likely to exhibit 'rapid intensification,” said @MichaelEMann while discussing Zeta's impact. pic.twitter.com/PfvXIhTLOR

— julie dermansky (@jsdart) November 1, 2020

Hurricane Eta


This hurricane had one of the most unusual paths of the entire 2020 season.  The path began as most did in the Eastern Caribbean on Halloween.  It strengthened rapidly and was a Category 4 hurricane when it made landfall Nicaragua.  This was the first hurricane of the season to hit the country.  The strongest of the season, Hurricane Iota, devastated Nicaragua only two weeks after this one.

After slowly pressing through parts of Central America, a much weaker Eta moved back into the Caribbean and raced toward Cuba on November 7.  The path became very erratic over the next several days.  It moved through the Florida Keys and then stalled in the southern parts of the Gulf of Mexico.  The storm fluctuated in intensity this entire time. It finally picked a direction and moved toward the Southeastern U.S. Landfall as a tropical storm occurred near Cedar Key, FL on November 12.

  • $1.5 Billion in damage 
  • 53 mph wind gust at Dania Beach, FL. 
  • 15.79” of rain fell in Miramar, FL.
  • Major flooding reported across Florida
  • Florida’s largest COVID-19 testing site, in Miami Gardens, was flooded. 
  • 140 people were rescued at a school in Charlotte NC, when floodwaters reached the first-floor windows.

▶️ Tropical Storm Eta brought heavy rains to North Carolina, flooding an area of Charlotte and leaving cars stranded, Thursday.

👉 Tropical Storm Eta Makes Second Florida Landfall https://t.co/bLiX6rupWz pic.twitter.com/PYfDWxx7qQ

— The Voice of America (@VOANews) November 13, 2020

Tropical storm Eta sent a 3.69 ft. storm surge into St. Pete. These are ‘before’ and ‘after’ photos of Coffee Pot Bayou. @BN9 pic.twitter.com/Fi0g8IVeOQ

— Josh Rojas (@JoshRojasBN9) November 16, 2020

Note:  All damage costs listed above for the United States only.

Sources

NOAA Overview of the 2020 Hurricane Season

National Hurricane Center Archive

2020 Hurricane Season via Wikipedia

NOAA:  Billion-Dollar Weather and Climate Disasters: Events

NWS Milwaukee Cristobal Recap

NWS Wakefield Isaias Summary

NWS Lake Charles Laura Summary

NWS Mobile Sally Summary

NWS Lake Charles Delta Summary

Filed Under: Uncategorized

January 3, 2021 By Jennifer Narramore

Biggest Events of 2020: The Tornado Season

The 2020 tornado season started off on an active note. January through April saw above-average tornado numbers thanks in part to several major outbreaks. However, once we moved into May, which is typically the peak of tornado season, things trended downward. Several tornado alley states saw low tornado totals. Here is a break-down of the more notable events. 

March 2-3, 2020

During the afternoon/evening of March 2 into the early morning hours of March 3, an outbreak of 15 tornadoes tore across the Tennessee Valley.  One tornado occurred in Missouri, two each in Kentucky and Alabama, and the other 10 were in Tennessee.

Nashville Tornado:

  • Rated EF-3, max wind speed: 165 mph.
  • Fatalities: 5, Injuries: 220.
  • Path Length: 60.13 miles, Path Width: 1600 yards. 
  • Tracked from just west of the John C. Thune Airport, moved across the northern part of downtown Nashville, through the Hermitage, Mt. Juliet, and Lebanon areas, dissipated southeast of Gordonsville. 
  • Caused $1.504 Billion in damage, this ranks as the 6th costliest tornado in US history! 
  • The longest tornado in Middle Tennessee since official records began in 1950.

Damage in the Mount Juliet Area, via NWS Nashville.

Cookeville Tornado: 

  • Rated: EF-4, max wind speed: 175 mph.
  • Fatalities: 19, Injuries: 87.
  • 17 large, well-built homes on Hensley Drive were leveled and swept away at EF-4 intensity. 
  • The deadliest tornado in Tennessee since 2008. 
  • The deadliest tornado in Putnam County history since records began in 1950.

Damage in Cookeville, via NWS Nashville.

The Easter Outbreak

On April 12-13, a large tornado outbreak slashed across the Gulf Coast states into the Mid-Atlantic. 140 tornadoes were confirmed. The strongest of the outbreak were rated EF-4. The tornadoes produced an estimated $3 billion in damage. There were a total of 32 fatalities.
Here is a break down of the ratings: 

  • 140 tornadoes 
    • EF-0: 31
    • EF-1: 74
    • EF-2: 19
    • EF-3: 13
    • EF-4: 3

An overview map via Wikipedia from TheAustinMan showing a map of every confirmed tornado, the tornado warnings, and the highest SPC Categorical outlook.

Notable Tornadoes In The Outbreak

Walthall, MS:

  • Rating: EF-4, peak wind speed: 170 mph.
  • Path Length: 21.21 Miles, Path Width: 1,320 yards.
  • Fatalities: 4, Injuries: at least 3. 
  • EF-4 rating based on a house that swept away leaving only a bare-foundation.

A few more pictures of the tornado damage in Walthall County, MS, taken Monday. This was from the initial tornado that quickly strengthened. #MSwx pic.twitter.com/8OmlsHY1zH

— David Paul (@MetDavidPaul) April 13, 2020

Bassfield-Soso-Moss, MS:

  • Rating: EF-4, Peak wind speed: 190 mph.
  • Path Length: 67.77 miles, Path Width: 2.25 miles.
  • Fatalities: 8, Injuries: at least 95.
  • Widest tornado in Mississippi history! Third widest tornado in US history, per the NOAA Database.
  • EF-4 damage was reported to several homes that were totally destroyed along the tornado’s path.
  • There were numerous shredded and debarked trees.

#BREAKING: Picture of the monstrous tornado that went through Bassfield & Soso, MS. #tornado #MSwx #bassfield #soso pic.twitter.com/Iwy1JOGSBj

— Antonio Maffei (@AMaffeiWX) April 12, 2020

Estill, SC:

  • Rating: EF-4, peak wind speed: 175 mph.
  • 24.04 Miles, Path Width: 1,300 yards.
  • Fatalities: 5, Injuries: 65.
  • EF-4 damage occurred to a house that was completely destroyed. 
  • A federal prison in Estill was heavily damaged and inmates had to be re-located to Pennsylvania. 
  • First EF-4 tornado in South Carolina since 1995.

Terrible #tornado damage in Estill, SC. video courtesy: Jessie Anderson-Berens @ABCNews4 #scnews pic.twitter.com/3rcEGrh307

— Anne Emerson (@AnneTEmerson) April 13, 2020

Oak Vale-Collons-Rose Hill, MS:

  • Rating: EF-3, Peak Wind Speed: 150 mph.
  • Path Length: 84.1 Miles, Path Width: 1.15 miles.
  • Fatalities: 0, Injuries: at least 2.
  • Moved through mostly rural areas which limited the human impact.
  • Extensive tree damage across most of the path, many rural homes/farms damaged or destroyed. 
  • Longest tracked tornado of the outbreak.

LAWRENCE COUNTY DAMAGE 🌪: Alene’s grandmother’s house in Oak Vale had the entire roof ripped off. She survived with only a scratch to the knee. This was likely from the second of two long-track tornadoes in South Mississippi on Easter. 📷: Alene Smith @WJTV @NWSJacksonMS #MSwx pic.twitter.com/OlkMtG3VvO

— Jacob Lanier (@JacobLanierWx) April 13, 2020

Fort Oglethorpe, GA-Chattanooga, TN:

  • Rating: EF-3, Peak Wind Speed: 145 MPH.
  • Path Length: 18.37 Miles, Path Width: 1,500 yards.
  • Fatalities: 2, Injuries: 18.
  • EF-1 damage occurred in GA, the EF-3 damage was in TN. 
  • Hundreds of homes in the eastern part of Chattanooga were heavily damaged or destroyed.

Gonna throw some before-and-afters at you. Here's a neighborhood in East Chattanooga, TN (EF3 tornado) (Image: @Maxar) pic.twitter.com/u7r0Qrr6fT

— Sean Breslin (@Sean_Breslin) April 15, 2020

Seneca, SC:

  • Rating: EF-3, Peak Wind Speed: 160 mph.
  • Path Length: 16.71 Miles, Path Width: 1,000 yards.
  • Fatalities: 1, Injuries: 5.
  • The  BorgWarner factory was demolished, a large letter “B” from the sign of the factory was found 18 miles away. 
  • Many homes were damaged or destroyed.

Major #Tornado damage being reported across the Upstate. #Oconee Co. Emergency management confirming 1 person died in #Senece overnight. This is what's left of Seneca Baptist Church. pic.twitter.com/t88mJEZHd7

— Shale Remien (@ShaleRemien) April 13, 2020

Barnwell County, SC:

  • 5 EF-3 tornadoes ripped through Barnwell County. 
  • Severe tree damage occurred. 
  • Dozens of homes, businesses, and other buildings were damaged or destroyed by the tornadoes. 
  • 2 people were killed and at least 10 people injured in the county.

The 5 EF-3 tracks, as seen on the NWS Damage Assessment Toolkit.

Chatsworth, GA:

  • Rating: EF-2, Peak Wind Speed; 135 mph.
  • Path Length: 8.88 miles, Path Width: 860 yards. 
  • Fatalities: 8 Injuries: 24
  • Several trailer parks demolished. 
  • Frame homes heavily damaged.

Finished up another day in Chatsworth, GA. Will be deploying volunteers through the weekend. Interesting how precise this tornado was. pic.twitter.com/pGIFDZMZM1

— Sirens Project, Inc. (@sirensproject) April 17, 2020

The Ashby Tornado

On July 8, 2020, an extremely photogenic twister struck near Ashby/Dalton, MN. The tornado was rated EF-4. It swept away a house and debarked several trees, and scoured corn crops.

  • Rating EF-4, Peak Wind Speed: 170 mph.
  • Path Length: 9 miles, Path Width: 650 Yards.
  • Fatalities: 1, Injuries: 2.
  • Extremely photogenic tornado.
  • Several close up videos showed the extremely violent motion of the tornado and the ground scouring as it occurred.

Outer circulation with corn stalks and other debris flying around me while filming the Ashby, MN tornado! Shot with my Nikon D800 and Nikkor 14-24 superwide lens all the way wide!https://t.co/976uptiPtW pic.twitter.com/4FMgT7vElE

— Scott Peake (@ScottPeakeWX) July 10, 2020

The Season That Wasn’t In Kansas

A total of 17 tornadoes were confirmed in Kansas. This is well below the average number of 95. All but one of these tornadoes were considered landspouts and most were rated EF-0 or EF-Unknown.

  • The strongest tornado was an EF-1 on July 2, near Seward. 
  • Only two tornado warnings were issued by NWS Wichita, well below the average number of 36. 
  • The first time since 1950 that zero tornadoes were confirmed in the NWS Wichita CWA. 
  • 16 out of the 17 tornadoes were weak landspouts. 

On average, Kansas has had 95 tornadoes a year since 1991. This year however, set a new low for the period AND all time. Only 17 were observed!! (Assuming no more since September) #kswx pic.twitter.com/OwOsFv8HTq

— Kansas Mesonet (@ksmesonet) December 27, 2020

Sources

March 2-3, 2020 Tornadoes and Severe Weather

2020 Easter Sunday Outbreak (NWS Jackson MS)

April 12-13 Severe Weather Outbreak (NWS Peachtree City) 

April 13th 2020 Tornado Outbreak (NWS Columbia) 

Southeast SC/GA Tornadoes – April 13, 2020 (NWS Charleston SC) 

Review of the damaging EF-4 tornado across west-central Minnesota on July 8th, 2020


Filed Under: Uncategorized

January 3, 2021 By Jennifer Narramore

The Biggest Weather Events of 2020

dougimage1
Aerial photo of flooding in downtown Midland, Mich., Wednesday, May 20, 2020.  © Kelly Jordan and Junfu Han – USA TODAY NETWORK
NOAA Satellite Image of Hurricane Laura on August 26, 2020.
A composite radar of the Derecho moving across the Midwest, via NWS Chicago.
Photo of the Ashby/Dalton MN EF-4 Tornado, taken by Brad Nelson, via NWS Grand Forks.
View of the Santiam fire from Salem, Oregon on September 8th. Photo by Bruhmoney77 on Wikipedia.

Previous
Next

2020 was certainly a year we will never forget!  And it definitely had its share of unforgettable weather events!  From a historic tropical season to massive fires to an oddly quiet tornado season in Kansas, we are taking a look back at the biggest weather events of the year!

We have placed our picks in six different categories: Tornadoes, Floods, Derechos, Wildfires, The Tropics, Winter Storms.  We have only been able to scratch the surface with our recap and there are many events we have missed.  Let us know on Facebook or Twitter which events made your list! 

Click on the category below to go to the article:

Tornadoes

Floods

Winter Storms

Wildfires

Derechos

Tropics

Filed Under: blog-2

January 3, 2021 By Jennifer Narramore

Biggest Events of 2020: Historic Flooding in Midland, MI


“Observed rainfall map from the North Central River Forecast Center (left); map of the Saginaw River watershed with approximate area of heaviest rainfall outlined in red.” From the NWS Detroit.

Parts of Michigan were inundated with heavy rain from the morning of May 17, 2020 through the afternoon of May 19.  A low pressure system and front stalled across the region. Per the NWS Detroit, widespread rain totals of 5-8 inches were observed in the Tri Cities region (Saginaw, Bay City, Midland) and into parts of northern Lower Michigan.  This rain amount overwhelmed the Tittabawassee River.


Hydrograph of the Tittabawassee River at Midland via NWS Detroit.

Per the NWS Detroit, “Exacerbating this issue was an already stressed dam system at Edenville and Sanford, which helps control the downstream flow along the Tittabawassee River into the city of Midland and eventually the Saginaw River. With increasing elevation heading north into northern lower Michigan, the heaviest rain totals (7-8 inches in Gladwin and Arenac counties), resulted in excess runoff flowing in a general north to south direction towards the Edenville and Sanford dams.” 

During the evening of May 17, “catastrophic dam failures” occurred at Edenville and Sanford.  The result was historic flash flooding in both towns and in the city of Midland.  Much of downtown Midland was inundated.  Many homes were destroyed and several roads were closed due to washouts and destroyed bridges. Approximately 10,000 people were evacuated from the area. The NWS Detroit issued a rare flash flood emergency for the event.

https://youtu.be/qBuQMEvqGH4


Image of the failed Sanford dam. Credit: Ahmad Bajjey via NWS Detroit summary of the event.

Aerial footage of the failure of the Edenville dam. Credit: Midland Daily News via NWS Detroit summary of the event.

Aerial photo of flooding in downtown Midland, Mich., Wednesday, May 20, 2020. © Kelly Jordan and Junfu Han – USA TODAY NETWORK

Debris can be seen jammed up against the Sanford dam Tuesday, May 26, 2020. Floodwaters devastated communities like Midland and Sanford following the failure of two dams that flooded homes along the Tittabawassee River. © Mandi Wright – USA TODAY NETWORK

The NWS Detroit describes the impact of this event this way, “To help further understand the historic nature of this event, the rainfall recurrence interval for the Tittabawassee River watershed is estimated to be a once in a 200 year event. To explain this in a different way, each year this amount of rainfall has a 0.05% chance of occurring across this basin. These values are estimated, however, as recurrence intervals are calculated for point locations, not an entire watershed. However, the cumulative effects of the dam failures on top of the heavy rain resulted in a much greater historical effect to the magnitude of flooding experienced in the city of Midland and nearby surrounding areas. At the very least, the flooding that occurred will be remembered as a generation-defining event for those who experienced it firsthand.”

Sources

NWS Detroit Summary of the Event

Filed Under: Uncategorized

December 21, 2020 By Jennifer Narramore

Meteo Monday-Frost

A beloved tune during the holiday season is “The Christmas Song”.  It was sung by some of the greats:  Mel Torme, Nat King Cole, Bing Crosby and Perry Como.  And even more recently by Christina Aguilera and Michael Buble. “Chestnuts roasting on an open fire. Jack Frost nipping at your nose.”  Wait.  Who is this Jack Frost character?  And why is he nipping at our noses?  Is he the one that leaves the icy, feathery, pattern on the ground when we get the first near-freezing temperatures of the autumn season?  In this week’s Meteo Monday, we are talking about frost! We will explore the history of the mythical nose-nipper and discuss how frost REALLY forms! 

Jack Frost, much like his counterpart Old Man Winter, is a personification of wintry weather. He is often depicted as a mischievous character that brings in the cold and with that, we get frost, snow, and freezing temperatures.  Jack Frost first made his appearance in English Literature in the 1700s. The book “Round About Our Coal Fire” or “Christmas Entertainments” was published in 1734. It is here that we see one of the first references of Jack Frost. “This time of year being cold and frosty generally speaking, or when Jack Frost commonly takes us by the nose…” From that point on, the frigid fellow has made an appearance in many books, articles, comics, cartoons, songs, television shows, and movies.


19th-century cartoon depicting Jack Frost as a United States major-general during the American Civil War via Wikipedia.

Now, let’s take a look at what frost actually is and how it forms. Per the National Weather Service (NWS) Glossary, frost is described as “the formation of thin ice crystals on the ground or other surfaces in the form of scales, needles, feathers, or fans”.


How do you know when it’ll be a frosty morning? It all comes down to the dew point. Dew point is the way you measure atmospheric moisture. It is the temperature to which the air must be cooled, to reach saturation.  This is how you get dew. If this happens with surface temperatures below freezing, but the temperature within 4-5 feet of the ground is above freezing, the dew freezes on contact. And thus you have frost. Just because the surface temperature is below freezing doesn’t mean you’ll get frost. The temperature must fall to the dew point. Frost typically occurs under a clear sky, with light winds. 

Frost can damage sensitive plants and crops. During the growing season (which varies across the country), the NWS will issue frost advisories if a widespread frost is expected across the area. A frost advisory will be issued when air temperatures are between 33-36℉.  If the temperature is expected to drop below freezing, during the growing season, a freeze warning will be issued instead.


A graph from the NWS explaining the difference between a frost advisory and a freeze warning.

Local topography can also play a role in frost formation. Cold air is heavier than warm air, which will allow it “sink” down into valleys. Valleys will be cooler than the surrounding hill-tops, and therefore frost would be more likely to occur in the valley.

Sources

https://www.weather.gov/arx/why_frost

https://www.weather.gov/ctp/wwaCriteria

https://w1.weather.gov/glossary/index.php?word=Frost

https://writinginmargins.weebly.com/home/a-brief-history-of-jack-frost

https://upload.wikimedia.org/wikipedia/commons/9/98/Round_about_our_Coal_Fire%2C_or%2C_Christmas_Entertainments%2C_4th_edn%2C_1734.pdf

https://en.wikipedia.org/wiki/Jack_Frosthttps://w1.weather.gov/glossary/index.php?word=Dew+Point

Filed Under: blog-3

  • « Previous Page
  • 1
  • 2
  • 3
  • Next Page »

Real Personalities

When looking to add a trusted source for weather, you want someone who can connect with your audience.   Our meteorologists are also on-air personalities.    The Storm Report team delivers a fresh sound with relatable information to get through the day.  We are your staff meteorologists.

The Storm Report

Follow us on:

Real Passion

We love weather.   No two days are the same.   That fuels our passion.   When weather is serious, you will hear it in our voices.    No text-to-speech computer forecasts.   No robotic audio.   Humans connect with humans and that is what radio is all about.

Real Life

When your community hosts special events, the weather is always a factor.   We weave timely information into your forecast when it comes to fairs, parades, fundraisers or remote broadcasts.    If your weather is sponsored, we are the spokesperson, helping your client earn results.

Copyright © 2026 thestormreport.com